Example of the strategy used for PGD of Duchenne muscular dystrophy (DMD)
The single cell PCR protocol used for Duchenne muscular dystrophy (DMD), a disease characterised by large deletions of one or more exon(s) of the dystrophin gene in about 60% of DMD patients, involves multiplex amplification of one exon located in the deleted region, one non-deleted exon as an internal PCR control and a panel of informative polymorphic intragenic STR markers for ADO detection and discrimination of carrier embryos. Fluorescent PCR is preferred over conventional PCR (Ray et al., 2001;Girardet et al., 2003) because the sensitivity is several orders of magnitude higher, increasing accuracy and reliability (Findlay et al., 1995 and 1998). Furthermore, fluorescence-based protocols are highly amenable to multiplexing, which has great potential when applied to simultaneous detection of mutation sites and linked STR markers (Figure 3).
Figure 3.
Preimplantation genetic diagnosis (PGD) for Duchenne muscular dystrophy (DMD).
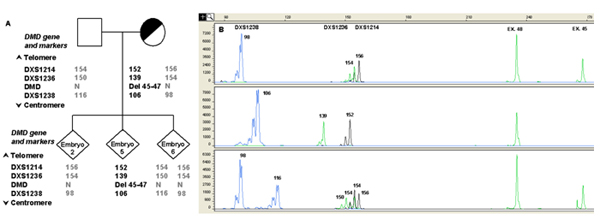
A) Informative STR markers are ordered from telomere (top) to centromere (bottom). The numbers in STR markers represent the size of PCR products in base pair (bp). Numbers in bold are the alleles linked to the mutation. Examples of different results of DMD mutation analysis are shown in the lower panel.
B) Capillary electrophoresis of fluorescent polymerase chain reaction (PCR) products obtained after multiplex amplification of the DMD region and a set of linked polymorphic markers. The x-axis shows length of PCR products in bp and the y-axis shows the fluorescence intensity in Relative Fluorescence Units (RFU). The single cell PCR protocol involved a multiplex amplification of one exon located in the deleted region (Exon 45), one non-deleted exon (Exon 48) used as internal PCR control and a panel of informative polymorphic intra-gene STR markers for ADO detection and discrimination of carrier embryos. The presence of the mutation (Del 45-47) is highlighted by the absence of the peak corresponding to Exon 45. The upper lane shows the result obtained from a normal male embryo (embryo 2), presenting the corresponding peak for Exon 45 and carrying the normal STRs haplotype. An affected embryo (embryo 5), in which the signal from Exon 45 is missing, also presenting the affected STRs haplotype, is shown in the middle lane. The lower lane shows the profile of a normal female embryo (embryo 6), presenting the corresponding peak for Exon 45 and the healthy paternal and maternal haplotypes. Numbers next to each peak represent the size of the allele (in bp).