Example of the strategy used for PGD of Congenital Adrenal Hyperplasia (CAH)
Linkage analysis was the strategy used in the PGD cycle for Congenital Adrenal Hyperplasia (CAH), performed in a consanguineous couple with an affected child, even though the disease causing mutation is known. In this case, during the preclinical work-up, following mutation analysis of the CYP21A2 gene, both partners were found to be homozygotes for the nucleotide (nt) 656 A-C?G mutation, without showing any clinical signs of the disease. Non-amplification of the normal allele at nt656 is a known phenomenon described in asymptomatic carriers (Day et al., 1996; Van de Velde et al., 1999). These putative nt656 G/G individuals are incorrectly typed due to drop-out of the normal allele during PCR amplification. In order to overcome the ambiguity at nt656, instead of direct detection of the mutation, a PGD strategy involving linkage analysis through multiplex fluorescent PCR of 6 STR markers flanking the CYP21A2 gene was developed (Figure 4). Because of the consanguinity of the couple, the affected child was showing a homozygous microsatellites profile (Figure 4). In order to exclude a multiple ADO occurrence leading to misdiagnosis of a healthy heterozygous embryo, which would appear affected and would not be transferred, a large number of STR markers was used. This method represents a reliable and flexible approach applicable to PGD of a wide spectrum of different genotype combinations causing 21-hydroxylase deficiency.
Figure 4.
PGD for Congenital Adrenal Hyperplasia (CAH) performed by linkage analysis.
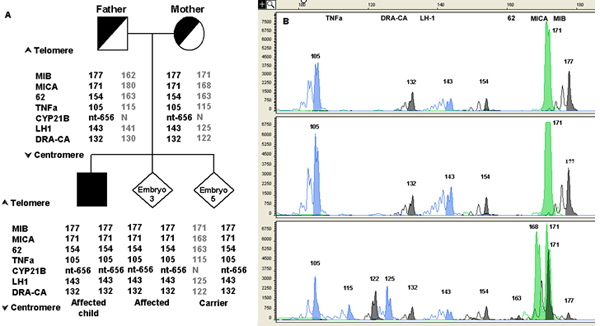
A) Pedigree of a couple carrying CAH mutations and examples of different results of the CYP21A2 gene mutation analysis. Specific haplotypes were determined by genomic DNA analysis of STR markers flanking the CYP21A2 gene from father, mother (upper panel) and affected child (lower panel-left side, black square). Informative STR markers are ordered from telomere (top) to centromere (bottom). The numbers in STR markers represent the size of PCR products in base pair (bp). STR alleles linked to the paternal and maternal mutations are represented in boldface.
B) Capillary electrophoresis of fluorescent polymerase chain reaction (PCR) products after multiplex analysis of 6 STR markers flanking the CYP21A2 gene. On top of the electropherogram the marker name is located above the corresponding alleles (peaks). Numbers next to each peak represent the size of the allele (in bp). The upper lane shows the STRs profile of the affected child. An affected embryo (embryo 3) is shown in the middle lane. The lower lane shows the profile of a carrier embryo (embryo 5), presenting both the affected and the normal haplotype.